Anatomy of Radiation Patterns
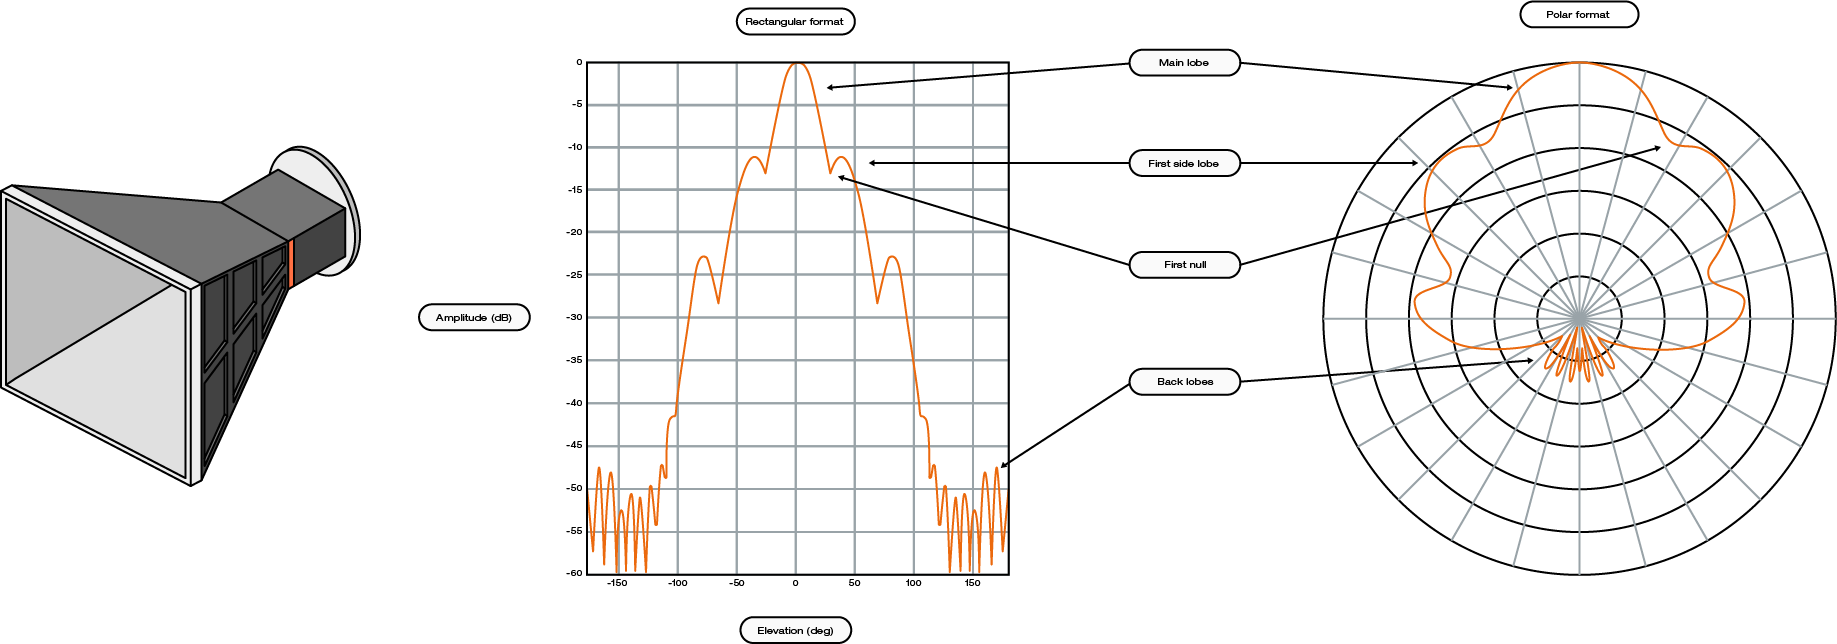
Radiation patterns are a measure of the radiated power as a function of far‐field spatial coordinates and is typically represented as a ratio of the power in any given direction to the power in the main lobe.
Antenna performance is often described using its principal E‐ and H‐plane patterns. These are 2‐dimensional representations of the radiated power as a function of a single spatial coordinate. This spatial coordinate depends on the polarization orientation of the antenna. For a linearly polarized antenna, the E‐plane pattern is defined as the plane containing the electric field vector and the direction of maximum radiation. The H‐plane is the plane containing the magnetic field vector and the direction of maximum radiation.
Side lobes usually represent radiation in undesired directions and should be minimized. Typically, the side lobe of most concern is the one adjacent to the main lobe and is referred to as the first side lobe. The level of the side lobes is usually expressed as a ratio of the power density of the side lobe of concern to that of the main lobe and is commonly referred to as the side lobe level.
According to the Ludwig 3 definition, when an antenna is linearly polarized, it is possible to align the unit vectors with the primary polarization of the AUT. This alignment enables the separation of the field into "co-polar" and "cross-polar" components throughout the entire 3D far-field sphere.
Polarization plays a crucial role in measuring the peak gain and assessing the co-polar and cross-polar levels of antennas. To ensure accurate measurements, it is necessary to align the probe and AUT fields. Interestingly, the accuracy of the positioner is typically of minimal importance since even small errors in alignment result in negligible effects on the peak gain measurement. However, when aiming to measure very low cross-polar levels, a positioner with good angular sensitivity becomes necessary.
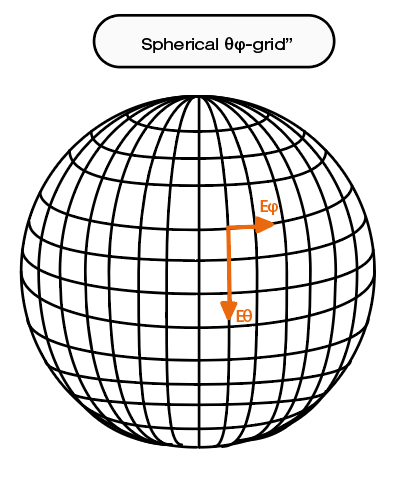
Both a single probe roll-over-azimuth system and a MVG multi-probe system adhere to the "standard θφ" spherical grid. During measurements, the linearly polarized probe is aligned with the θ axis and φ axis of the sphere, allowing the measurement of Eθ and Eφ field components of the AUT. These fields components enable the observation of co-polar and cross-polar fields on the two principal and orthogonal AUT cuts.
What Do We Want To Know?
Antenna performance can be quantified by various metrics that describe the radiating properties of the antenna. These measurement parameters may include free space, circuit, and transfer characteristics, many of which need to be measured in the far‐field. It must also be noted that all of these parameters can vary as a function of frequency.
- Free space characterization:
Radiation pattern measurement, (pointing, beamwidth),
Directivity measurement,
Polarization, (Tilt angle, Axial ratio, XPD - cross polar discrimination),
RCS (wave to wave scattering measurement).
- Circuit element characterization:
Impedance measurement,
Reflection coefficients measurement.
- Transfer characteristics:
Gain,
Efficiency,
Effective area.
- And we need all of these as a function of frequency!
- Note: bold items need to be measured in the far-field.
Far-Field Representation of Antenna Patterns
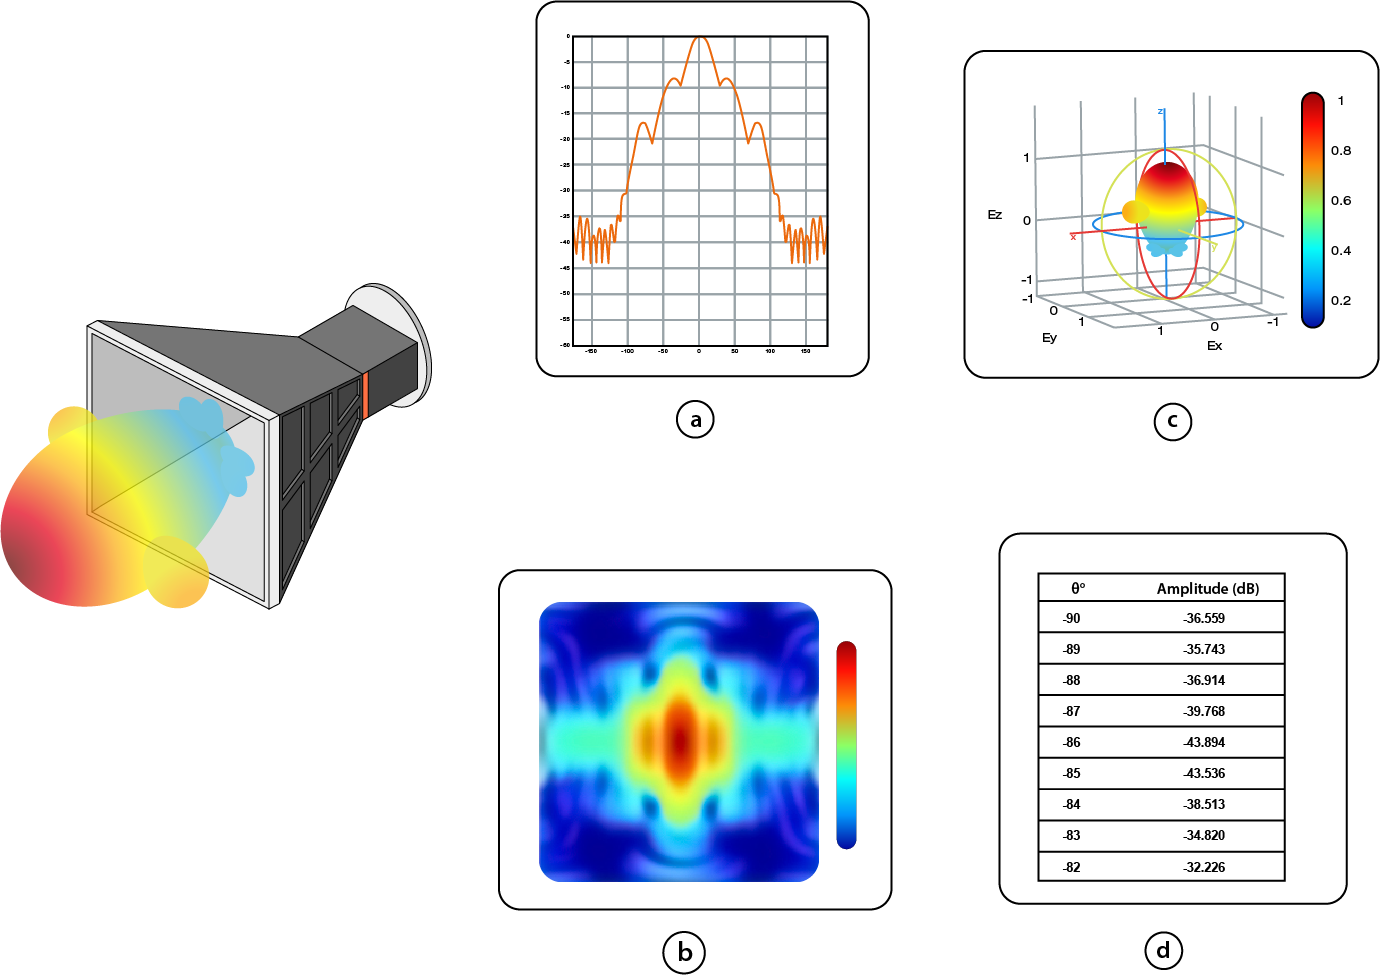
Antenna pattern data can be displayed in different forms. The images above present various data representations of the far‐field radiation pattern for the horn antenna shown.
Typical goal - characterization of an antenna’s far-field radiation pattern as a function of direction.
Typical output - a graphical pattern representation of the field as a function of direction - either a cut (a), a 2D view (b) or a 3D pattern (c).
Relative Power Pattern: Linear & dB Scales
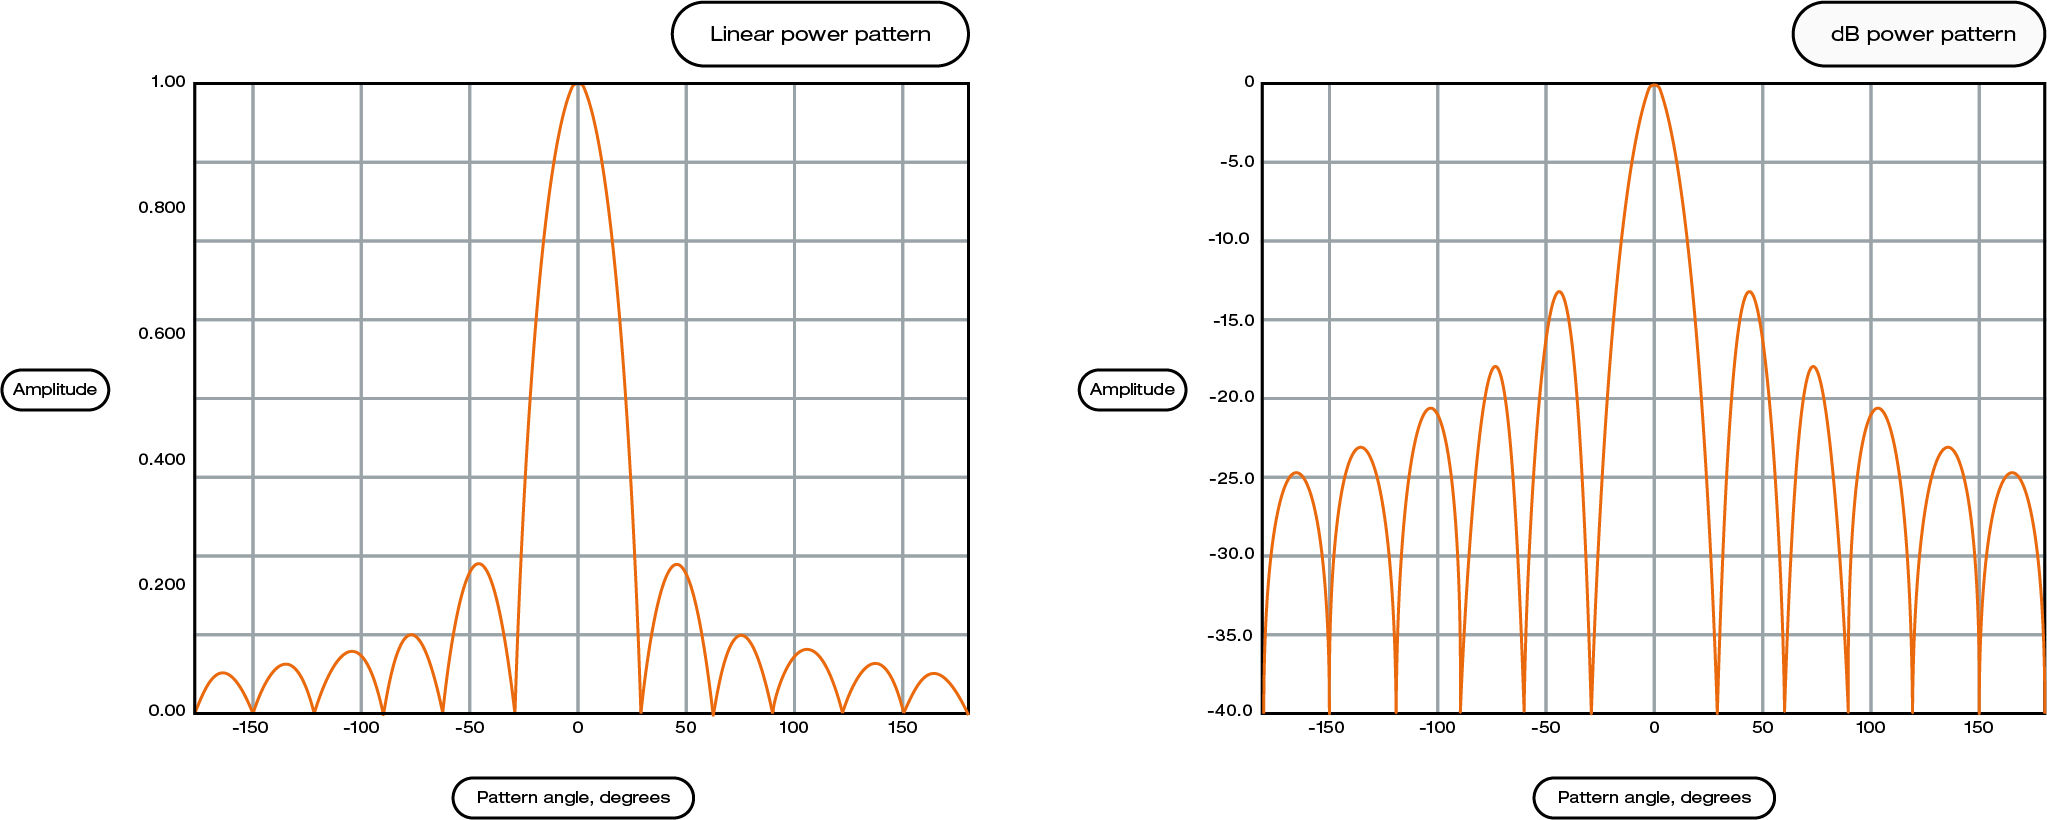
The antenna radiation pattern is a plot of the relative field strength versus angular position. Due to the large variations in this value, details of pattern characteristics at lower levels may be not as apparent. For this reason, radiation patterns are typically displayed on a logarithmic scale rather than a linear scale. The above plots are of the same radiation pattern, one on a linear scale and the other on a logarithmic scale.
Topic overview